Bitcoin (BTC) rebounded 2% on April 4 as a broad risk-asset rally followed encouraging signals from the United States Federal Reserve.

Fed sees rate cut “at some point this year”
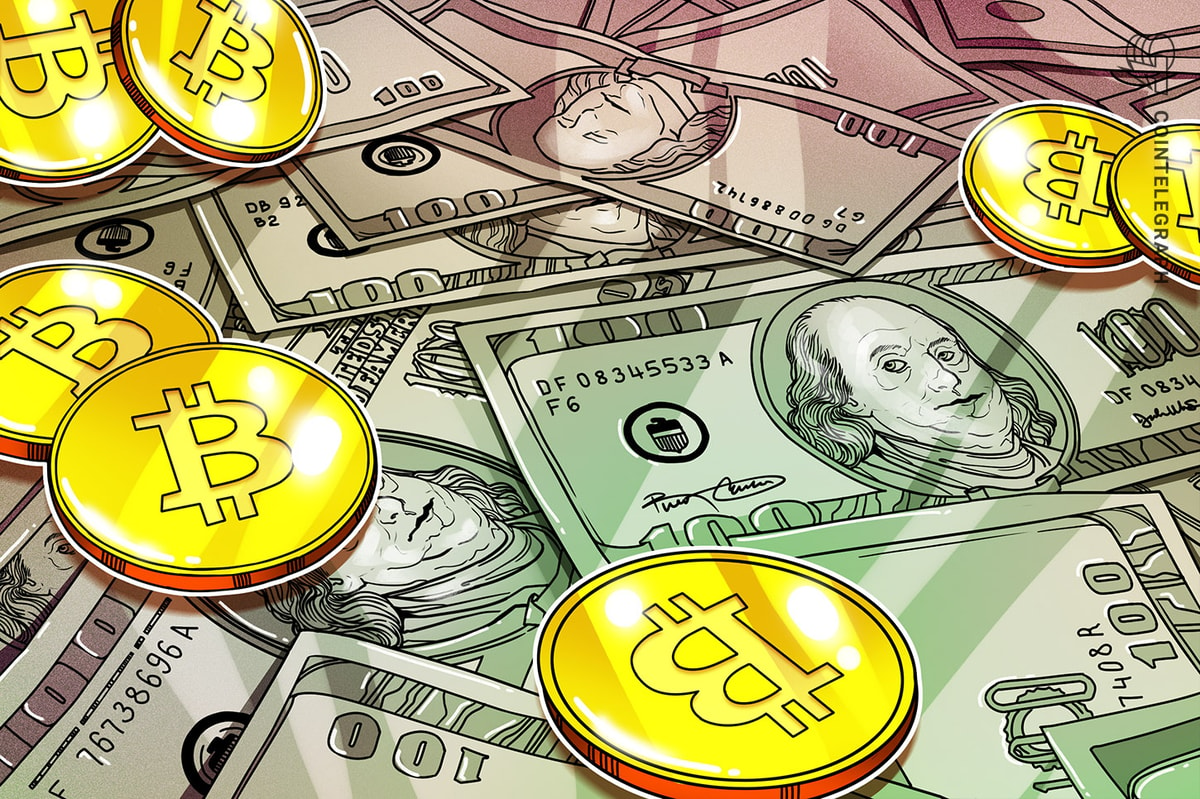
Data from Cointelegraph Markets Pro and TradingView showed local BTC price highs of $67,51 on Bitstamp around the Wall Street open.
Bitcoin joined U.S. stocks indices in heading higher on the day, while gold cooled after setting new all-time highs above $2,300.
The day prior, Fed Chair Jerome Powell delivered a dovish tone on economic policy, suggesting that interest rate cuts — a key boon for risk assets — would come before the end of 2024.
“We have held our policy rate at its current level since last July,” he said during a speech for the Stanford Business, Government, and Society Forum at the Stanford Graduate School of Business in Stanford, California.
“As shown in the individual projections the FOMC released two weeks ago, my colleagues and I continue to believe that the policy rate is likely at its peak for this tightening cycle. If the economy evolves broadly as we expect, most FOMC participants see it as likely to be appropriate to begin lowering the policy rate at some point this year.”
Powell referred to the Federal Open Market Committee (FOMC) meetings, the next of which due in May.
The latest data from CME Group’s FedWatch Tool nonetheless put the odds of a minimal 0.25% rate cut either at that meeting or the following one in June at 61% at best.

Meanwhile, the latest initial U.S. jobless claims came in slightly above expectations, at 221,000 versus 214,000 expected, providing additional upward impetus for market movement.
RSI stokes BTC price confidence
Analyzing current Bitcoin market structure, popular trader Pierre noted that the 200-period exponential moving average (EMA) on 4-hour timeframes was providing support.
Related: Bitcoin is hedge against ‘horrible’ gov’t fiscal policy — Cathie Wood

Optimistic as ever, fellow trader Jelle looked to promising signals on the daily chart as grounds to suspect upside continuation next.
Bitcoin’s relative strength index (RSI) crossed back above the key 50 point at the daily close. As Cointelegraph reported, daily RSI had been circling its lowest levels in several months.
“Bitcoin has locked in a hidden bullish divergence on the daily chart!” he told followers on X (formerly Twitter).
“This divergence often shows up during pullbacks, during a strong bullish trend – signalling the next leg higher. Bring on $82,000.”

This article does not contain investment advice or recommendations. Every investment and trading move involves risk, and readers should conduct their own research when making a decision.
Also Read More: World News | Entertainment News | Celebrity News